Data Analysis
Statistical & Graphical Representation Of DataResearch | Academics | Survey | Logistics | Medical
Analysis
Our Data Analysis Works
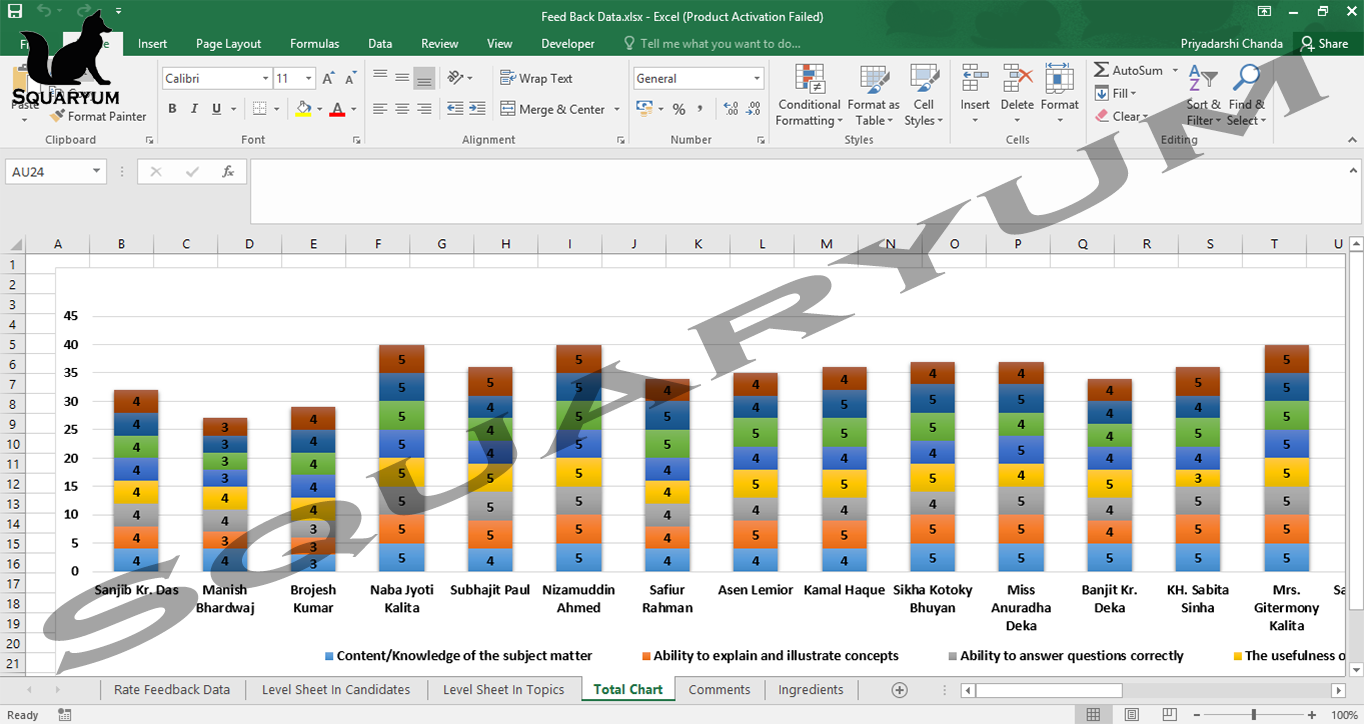
TNA (Training Need Analysis)
Analysis of a group of people or a set of groups of people, who are in need of different sets of trainings.
- Survey form creation (online & offline)
- Table creation from the survey data
- Analysis of the survey using different tools
- Plotting the output in the form of charts
NPS (Net Promoter Score)
Generally used in call center sections of different companies, where different customer queries & issues are handled by different customer support agents.
- Agent-wise, team-wise & place-wise NPS scoring
- Plotting of different graphs depending on the NPS scores
Revenue Based Analysis
Analysis of different revenue based concerns.
- Month-wise, week-wise & year-wise company revenue analysis
- Finding out the increase & decrease percentage of revenue
- Plotting graphs according to different results
Thesis Based Analysis
- Regression
- ANOVA
- T-Test
- Other tests & graph plotting according to thesis requirements
Main Office
Branch Office
Office
- East Kolkata Township, Kolkata, West Bengal, India
- New Town, Action Area 1, Kolkata, West Bengal, India
Hours
Everyday: 10am – 10pm
Call Us
Call: +91 9123341782
WhatsApp: +91 8981711236


